Partner dashboards
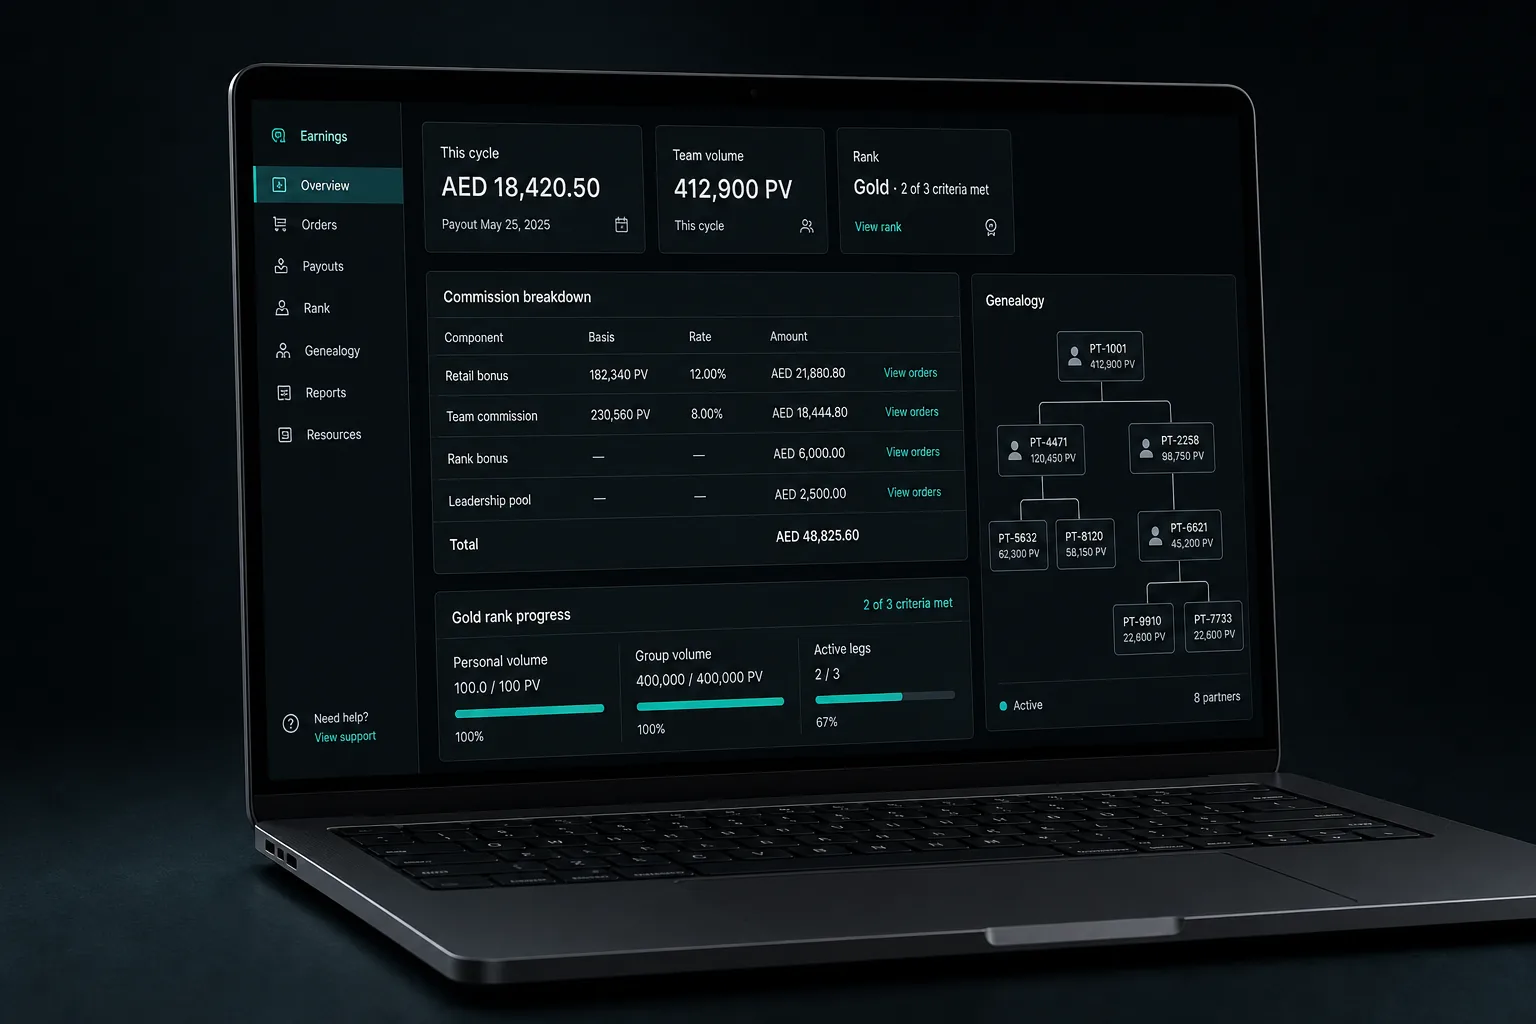
Real-time earnings, referral performance and tier progress for every partner.

- Engagement
- Fixed-scope build, partner pilot included
- Typical timeline
- 3–5 weeks
- Starts with
- The last two months of partner questions your team answered by hand.
Three questions arrive every day, each from a different partner: how much have I earned, was that sale counted, when am I paid. Every answer costs your partner manager two system logins and a little arithmetic.
Partners who stay because they can see their progress.
What we build
Concrete artefacts, handed over and documented.
A partner login showing earnings by period, with pending, approved and paid kept visibly separate
Sale-level detail, so a partner can check one specific order instead of asking whether it was counted
Tier progress and what the next tier requires, expressed in the partner’s own numbers
Everything they need in one place: links, codes, statements, tax documents, current terms
What changes
Routine partner questions arrive as dashboard visits rather than messages to your team
Partners chase their own missing sales, which surfaces tracking problems earlier than your reports would
Your strongest partners can see what one more sale does for them, which is the cheapest motivation available
How it runs
- Weeks 1–2
01Ask the partners
We read the last few months of partner questions to your team. The dashboard answers those, in that order of frequency.
- Weeks 3–4
02Build
Login, earnings, sale-level detail and tier progress, with strict isolation so no partner can reach another’s data.
- Week 5
03Roll out
A pilot with your five largest partners, whose objections are worth more than any internal review.
Chosen per project. Named here so you can see the shape of it.
- Supabase
- Postgres
- Metabase
- Vercel
Questions we get asked
Tell us the outcome, not the tooling.
Send us the situation you are in. We will tell you which discipline it belongs to, what we would do first and what it costs, including when the answer is to wait.