AI reporting systems
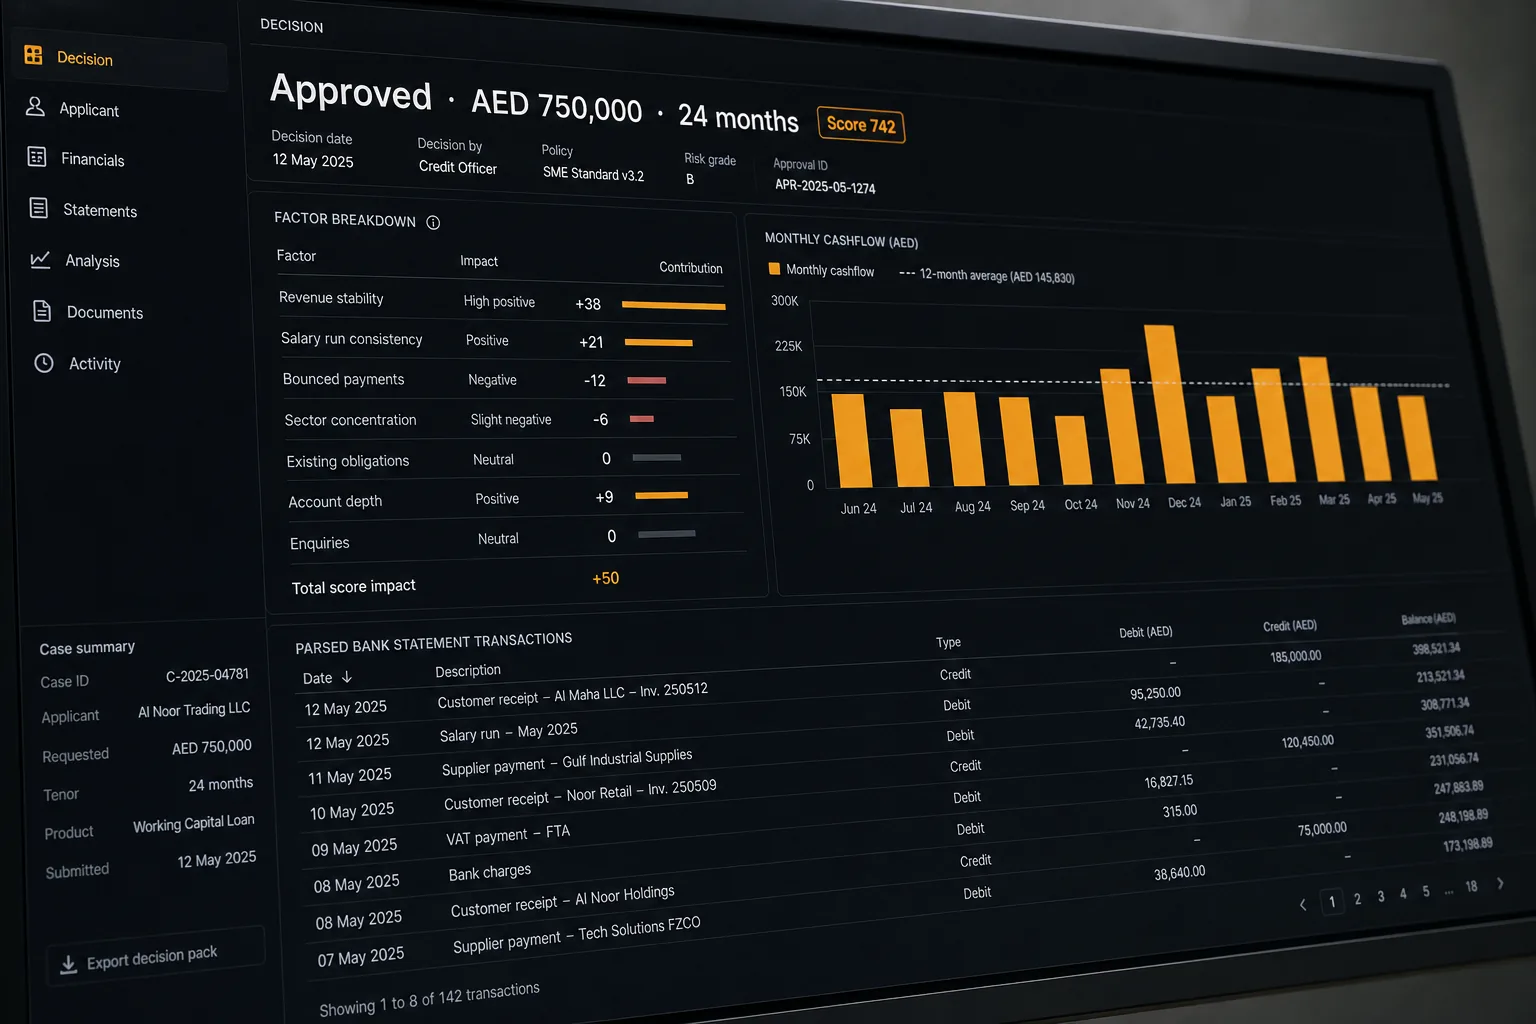
Narrative reports generated from live data, explaining what changed and why.

- Engagement
- Fixed-scope build, run beside your current pack
- Typical timeline
- 6 weeks, across two reporting cycles
- Starts with
- Your last three board packs and the queries behind the numbers in them.
Three days a month disappear into the board pack: pulling figures, pasting charts, writing the paragraph that explains why revenue moved. The numbers were never the difficult part. The commentary was, and it always falls to the person with the least time to write it.
The weekly report writes itself, on time, every time.
What we build
Concrete artefacts, handed over and documented.
One agreed set of metrics calculated in the database, so the narrative and the chart can never disagree with each other
Commentary generated only from those computed figures, with the movement decomposed by segment, product and period
Exception flagging against thresholds you set, so an unusual number is called out rather than buried in a table
Scheduled delivery into wherever your readers already are, inbox, Slack, or the deck template your board expects
What changes
The monthly pack arrives on the first working day without anyone assembling it
Every sentence of commentary can be traced back to a query
Analyst time shifts from producing reports to answering the questions they raise
How it runs
- Week 1
01Agree the metrics
We settle the definitions, what counts as revenue, when it counts, which customers are active, before anything is written.
- Weeks 2–4
02Numbers, then narrative
A deterministic calculation layer first, with the written explanation built strictly on top of it.
- Weeks 5–6
03Two cycles in parallel
The generated pack runs alongside the manual one for two periods, and we reconcile every difference.
Chosen per project. Named here so you can see the shape of it.
- Postgres
- dbt
- Anthropic Claude
- Slack
- Looker Studio
Questions we get asked
Tell us the outcome, not the tooling.
Send us the situation you are in. We will tell you which discipline it belongs to, what we would do first and what it costs, including when the answer is to wait.