Custom dashboards
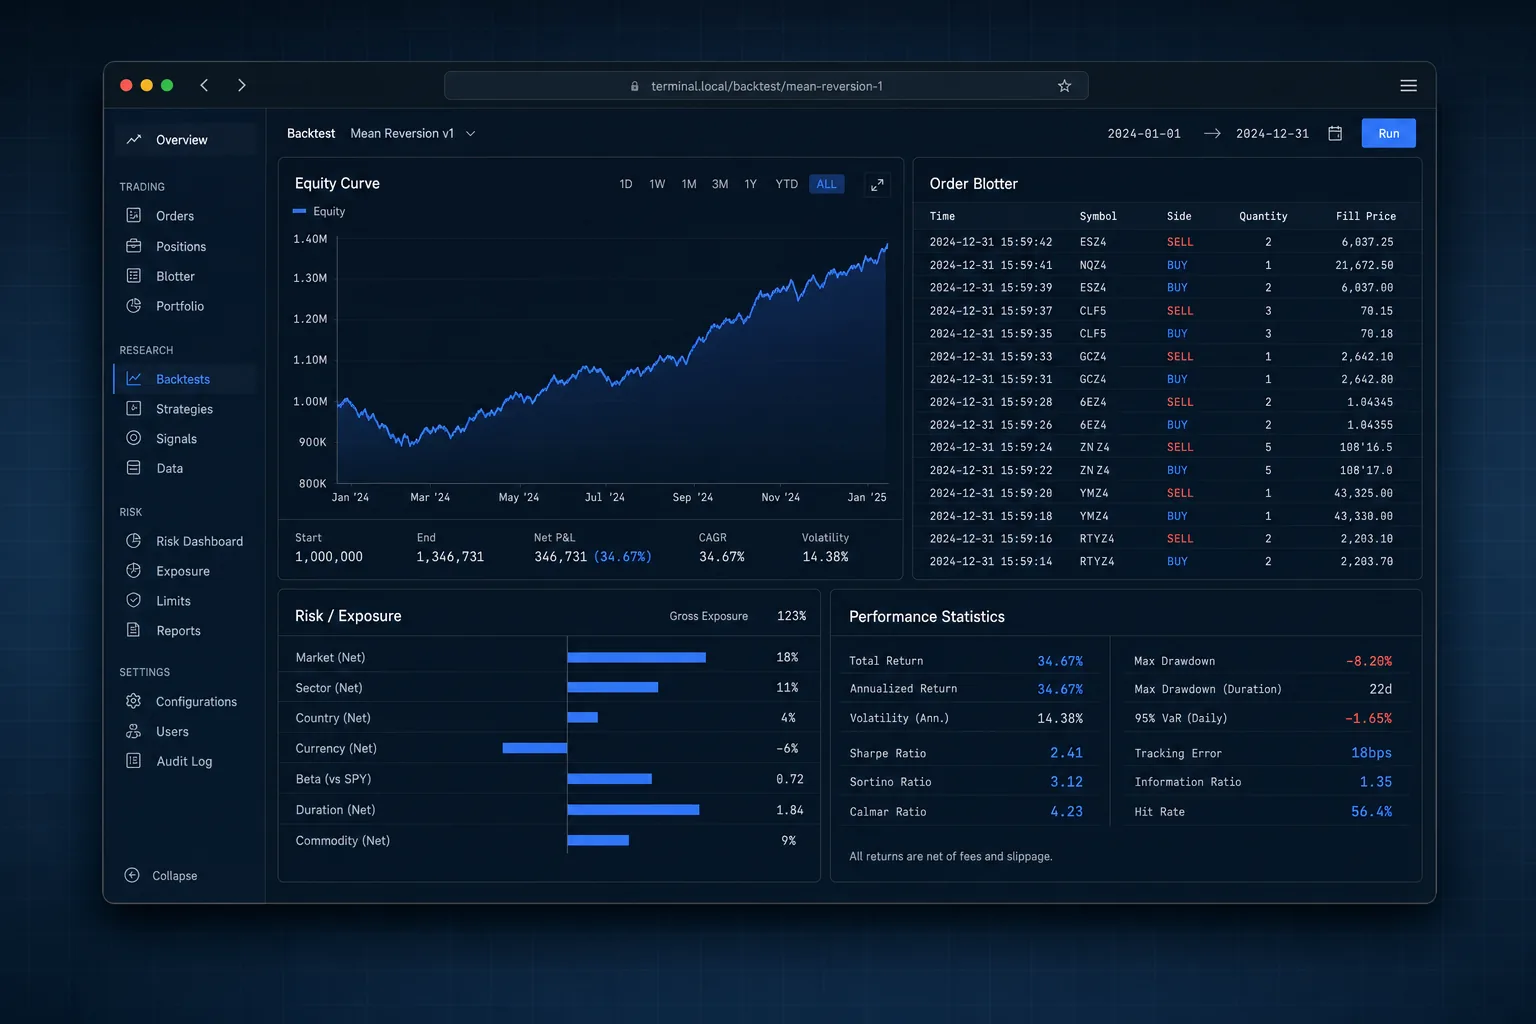
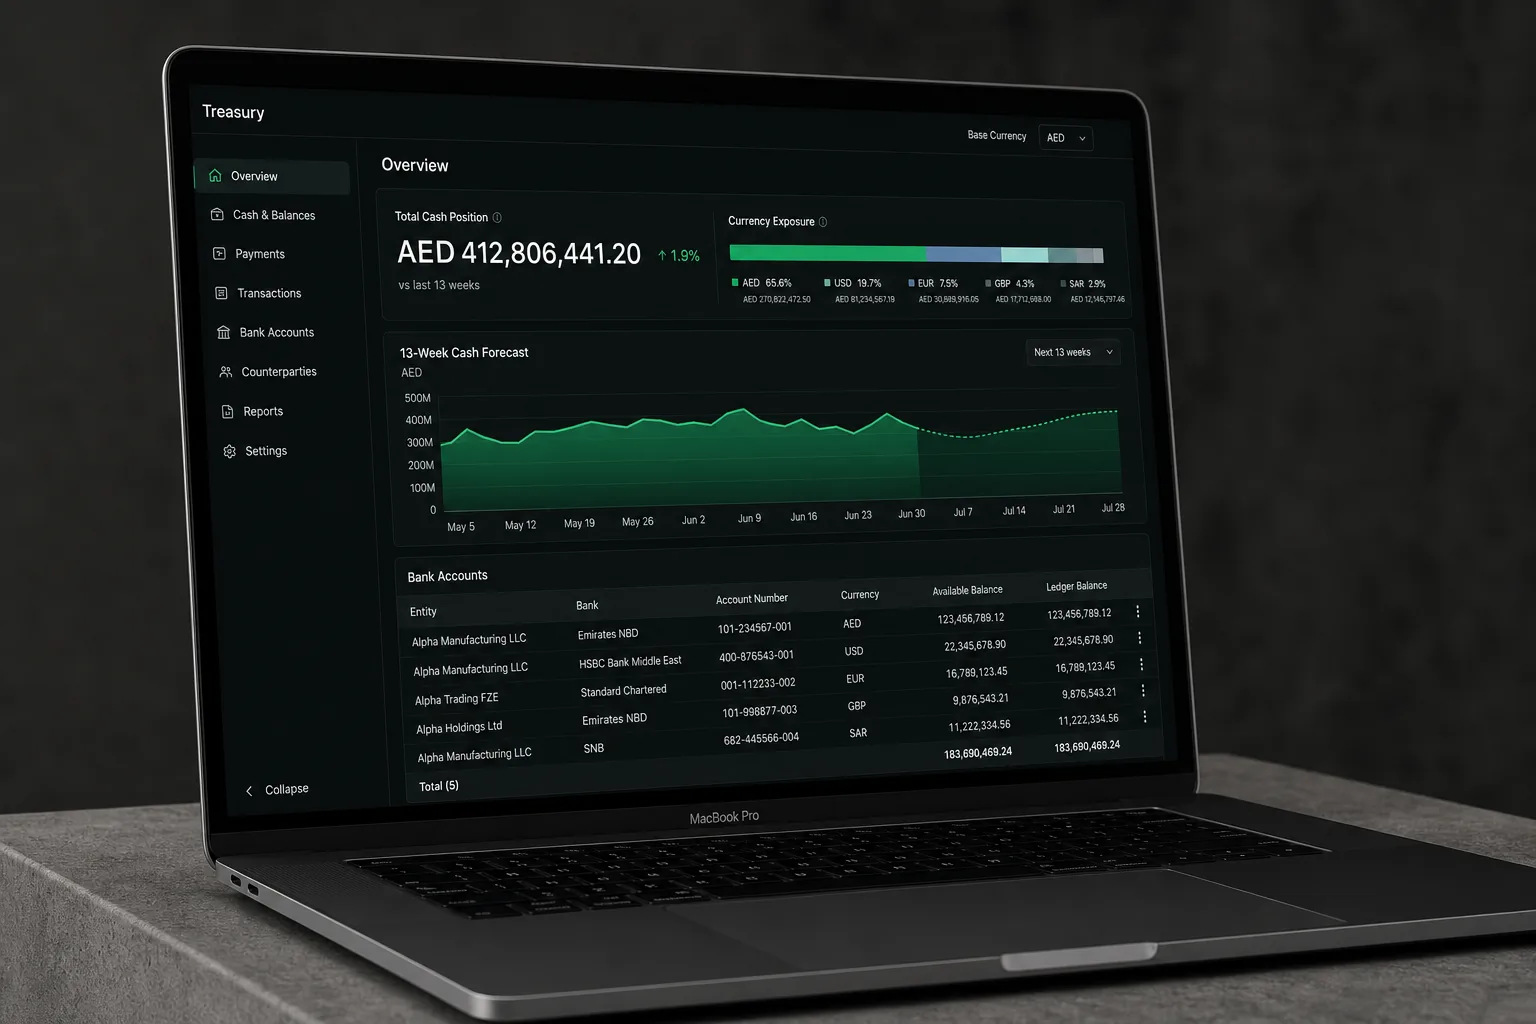
Operational interfaces combining data, alerts and actions in one place.
- Engagement
- Fixed-scope build
- Typical timeline
- 6 weeks
- Starts with
- Half a day sitting beside whoever currently keeps the most tabs open.
Your operations lead keeps five tabs open, refreshes two of them by hand, and still asks in a group chat whether an order shipped. Every number exists somewhere. Nothing puts them on one screen with a button beside them.
Seeing and acting without switching between six tabs.
What we build
Concrete artefacts, handed over and documented.
One screen per role, showing only what that person can act on
Actions beside the numbers, approve, reassign, refund, escalate, writing straight back to the source system
Thresholds and alerts, so the screen tells someone instead of waiting to be looked at
A stated refresh interval printed on the screen, so nobody argues about whether a figure is stale
What changes
The group-chat questions stop, because the answer is already on the screen
The gap between noticing a problem and acting on it becomes one click
Everyone in the operation is reading the same figures at the same moment
How it runs
01Watch the tabs
We record which screens your team keeps open all day and which numbers they copy between them.
02Build
Screens and actions, released weekly to the handful of people who will live in them.
03Alerts
Thresholds set from real history rather than from guesswork, handed over with an owner named against each alert.
Chosen per project. Named here so you can see the shape of it.
- TypeScript
- Next.js
- Postgres
- Redis
- Sentry
Questions we get asked
Tell us the outcome, not the tooling.
Send us the situation you are in. We will tell you which discipline it belongs to, what we would do first and what it costs, including when the answer is to wait.